Hello WOrldData Analytics Introduction Using Python Training
Introduction
Welcome
We are embarking on a journey, with multiple stops but the destination will be far out. The stops will be areas of expertise and learning that we will have done and practiced but the destination is the progressive accumulation of the learning.
With the ever evolving changing of technology the destination will always be changing.
Assumptions
Have some limited or little knowledge of Microsoft excel functions e.g =sum(C1,C2), though not mandatory it makes it easier to grasp concepts slightly faster. Though if you remember the simple mathematics we do everyday of summing and adding money then you are good :).
Requirements
- Interest and Desire to learn
- Working Computer (Laptop/Desktop)
- Access to internet once in a while to download a few resource materials
Teaching guide
Mixed instructional guide, with the presentation but focused on getting more hard skills
Engagements and practice on the fly
Data Analytics
Colloquial term data analytics can be coined as both a science and an art. With the science part majorly following statistical/mathematical procedures used, art comes from the different ways and methods someone can use to present and execute the since part of it.
Tools for Data Analytics
There are various tools/Software/applications can be used for data analysis
- Paid for:
- Ms Excel
- Ms Power BI
- SPSS
- STATA
- SAS
- MS SQL
- Open Source: Free
- Python
- R
- Postgres
- Julia
- MangoDB
- CouchDB
Python
Python Introduction
Open Source Programming language.First come to use in the early 1990’s and developed by Guido Van Rossum more information here.
Advantages
- Easy to learn
- Almost language like syntax
- Fast execution
- All Purpose programming language:
- used for software development
- used for data analysis
- used for machine learning
- used for web development
Disadvantages
- Some convections are different from other programming language
- High level interpreted language
Python Interface
Python programming language uses it’s in build command prompt frequently called CLI standing for Command Line Interface, search through windows/MAC program files and you should see Python 3.0.0) there are various versions of python and depending on which one you have installed this will determine the python CLI.
Though you can be able to do everything using this, it doesn’t give an intuitive user interface hence the reason for development of IDE Integrated Development Environment.
IDE is the dashboard similar to car dashboard but the actual software the engine is now python for this case.
- Pycharm
- Spyder
- jupyter
- vsCode
- Rstudio
- Positron (New in Beta)
- Text editors
- notepad ++
- vim
- sublime
- e.t.c
Though there are many and the tool of choice is open for use, for now we can focus on using vsCode as this is universal to also other programming languages but if you are interested in a polygot system you can test positron.
Let us check what installations you have
- Python Installation
- IDE Installation
- To install all this together we prefer anaconda
- Anaconda | full suit of packages and tools
- miniconda | minimal and necessary packages
Python | Hello World
Python being an interpreted high level programming language, making things easier for the programmer. Able to pick up the things very easily.
Let us start with the first code.
Let us use it as a calculator.
Using it as an input
Using comments
Assigning objects to names variables
Code
DT
Customs
Rules for variable names
- Can’t start with numbers (1,2,3,4….)
- Letter, numbers, underscores are allowed in the name but ’,-, spaces are not allowed
python has keywords this are words that have syntactical use in the program below list even though not fully conclusive.
and continue except global lambda raise yield
as def exec if not return
assert del finally import or try
break elif for in pass while
class else from is print with
Numbers
Integers, floating point numbers and complex numbers falls under Python numbers category.
We can use the
type()function to know which class a variable or a value belongs to and theisinstance()function to check if an object belongs to a particular class.
Code
5 is of type <class 'int'>
2.0 is of type <class 'float'>
(1+2j) is of type <class 'complex'>
(1+2j) is complex number? True
Strings
sequence of characters used to store and represent text-based information
Code
print(first_string.capitalize())
print(first_string.title())
print(first_string.upper())
print(first_string.swapcase())
print(first_string.find('is'))
print(first_string.replace('first', 'second'))
print(first_string.strip())
print(first_string.isalnum())
print(first_string.isalpha())
print(first_string.isdigit())
print(first_string.isprintable())
List
Mutable ordered sequence of items.
List objects provide several methods
Tuples
Immutable ordered sequence of items.Tuples once created cannot be modified.
Sets
Ordered collections of unique items.
Code
set()Dictionary
Arbitrary collection of objects indexed by nearly arbitrary values called keys.
{'a': [1, 2, 3], 'b': [4, 5, 6], 'c': [7, 6, 8]}Code
{'x':42, 'y':3.14, 'z':7} # Dictionary with three items, str keys
{1:2, 3:4} # Dictionary with two items, int keys
{1:'za', 'br':23} # Dictionary with mixed key types
{} # Empty dictionary


dict(x=42, y=3.14, z=7) # Dictionary with three items, str keys
dict([(1, 2), (3, 4)]) # Dictionary with two items, int keys
dict([(1,'za'), ('br',23)]) # Dictionary with mixed key types
dict() # Empty dictionary
Methods
Method: Attributes associated to different objects and data types. As well classes at a broader level
Code
['My', 'first', 'String']Functions
associativity of the operator: L (left-to-right), R (right-to-left), or NA (nonassociative).
| Operator | Description | Associativity |
|---|---|---|
{key:expr,...} |
Dictionary creation | NA |
{ expr ,...} |
Set creation | NA |
[ expr ,...] |
List creation | NA |
( expr ,...) |
Tuple creation or just parentheses | NA |
f ( expr ,...) |
Function call | L |
x [ index : index ] |
Slicing | L |
x [ index ] |
Indexing | L |
x . attr |
Attribute reference | L |
x ** y |
Exponentiation (x to the yth power) | R |
~ x |
Bitwise NOT | NA |
+x, -x |
Unary plus and minus | NA |
x*y, x/y, x//y, x%y |
Multiplication, division, truncating division,remainder | L |
x+y, x-y |
Addition, subtraction | L |
x<<y, x>>y |
Left-shift, right-shift | L |
x & y |
Bitwise AND | L |
x ^ y |
Bitwise XOR | L |
x | y |
Bitwise OR | L |
x<y, x<=y, x>y, x>=y, x<>y (v2 only),x!=y, x==y |
Comparisons (less than, less than or equal, greater than, greater than or equal, inequality, equality)a | NA |
x is y, x is not y |
Identity tests | NA |
x in y, x not in y |
Membership tests | NA |
not x |
Boolean NOT | NA |
x and y |
Boolean AND | L |
x or y |
Boolean OR | L |
x if expr else y |
Ternary operator | NA |
lambda arg,...: expr |
Anonymous simple function | NA |
Python | Further into Hello World
Conditions criteria where we compare values and decide what step to take. Example of conditional criteria if-else , if-elif-else, while.
Comparison operators go hand in hand with conditions. Comparison operators inculde == , <=, >=, |, &, or, and e.t.c
Iterations is repeating and the most common form of iteration is for Code highligt for for
Python modules
Modules introduction
When our program grows bigger, it is a good idea to break it into different modules.
A module is a file containing Python definitions and statements. Python modules have a filename and end with the extension .py.
Definitions inside a module can be imported to another module or the interactive interpreter in Python. We use the import keyword to do this.
For example, we can import the math module by typing in import math.
Checking paths using sys module
['C:\\Users\\brian\\AppData\\Local\\Programs\\Python\\Python39\\python39.zip', 'C:\\Users\\brian\\AppData\\Local\\Programs\\Python\\Python39\\DLLs', 'C:\\Users\\brian\\AppData\\Local\\Programs\\Python\\Python39\\lib', 'C:\\Users\\brian\\AppData\\Local\\Programs\\Python\\Python39', '', 'C:\\Users\\brian\\AppData\\Local\\Programs\\Python\\Python39\\lib\\site-packages', 'C:\\Users\\brian\\AppData\\Local\\Programs\\Python\\Python39\\lib\\site-packages\\win32', 'C:\\Users\\brian\\AppData\\Local\\Programs\\Python\\Python39\\lib\\site-packages\\win32\\lib', 'C:\\Users\\brian\\AppData\\Local\\Programs\\Python\\Python39\\lib\\site-packages\\Pythonwin']Python numpy | Introduction
numpy: python module/library specialized in Arrays and Vectorized Computation.
NumPy, short for Numerical Python, is one of the most important foundational packages for numerical computing in Python. Numpy works with array from 1-n dimensional.
array([0, 1, 2, 3, 4, 5, 6, 7, 8, 9])Multidimensional Array
Code
data = np.array([[1.5, -0.1, 3], [0, -3, 6.5]])

data

a = np.array([1,2,3])
b = np.array([(1.5,2,3), (4,5,6)], dtype = float)
c = np.array([[(1.5,2,3), (4,5,6)],[(3,2,1), (4,5,6)]], dtype = float)

np.zeros((3,4)) #Create an array of zeros
np.ones((2,3,4),dtype=np.int16) #Create an array of ones
d = np.arange(10,25,5)#Create an array of evenly spaced values (step value)
np.linspace(0,2,9) #Create an array of evenlyspaced values (number of samples)
e = np.full((2,2),7)#Create a constant array
f = np.eye(2) #Create a 2X2 identity matrix
np.random.random((2,2)) #Create an array with random values
np.empty((3,2)) #Create an empty array
array([[1.39069238e-309, 1.39069238e-309],
[1.39069238e-309, 1.39069238e-309],
[1.39069238e-309, 1.39069238e-309]])Code
g = a - b. #Subtraction

np.subtract(a,b) #Subtraction
b + a #Addition

np.add(b,a) #Addition
a/b #Division

np.divide(a,b) #Division
a * b #Multiplication

np.multiply(a,b) #Multiplication
np.exp(b) #Exponentiation
np.sqrt(b) #Square root
np.sin(a)  #Print sines of an array
np.cos(b) #Elementwise cosine
np.log(a)#Elementwise natural logarithm
e.dot(f) #Dot product
Comparison
Sorting Arrays
**Subsetting, slicing, indexing
Code
a[2] #Select the element at the 2nd index

b[1,2] #Select the element at row 1 column 2(equivalent to b[1][2])


a[0:2]#Select items at index 0 and 1

b[0:2,1] #Select items at rows 0 and 1 in column 1

b[:1] #Select all items at row0(equivalent to b[0:1, :])

c[1,...] #Same as[1,:,:]

a[ : : -1] #Reversed array a array([3, 2, 1])

a[a<2] #Select elements from a less than 2

b[[1,0,1, 0],[0,1, 2, 0]] #Select elements(1,0),(0,1),(1,2) and(0,0)

b[[1,0,1, 0]][:,[0,1,2,0]] #Select a subset of the matrix’s rows and columns
Code
i = np.transpose(b) #Permute array dimensions
i.T #Permute array dimensions

b.ravel() #Flatten the array
g.reshape(3, -2) #Reshape, but don’t change data

h.resize((2,6)) #Return a new arraywith shape(2,6)
np.append(h,g) #Append items to an array
np.insert(a,1,5)  #Insert items in an array
np.delete(a,[1])  #Delete items from an array


np.concatenate((a,d),axis=0) #Concatenate arrays

np.vstack((a,b) #Stack arrays vertically(row wise)

np.r_[e,f] #Stack arrays vertically(row wise)
np.hstack((e,f)) #Stack arrays horizontally(column wise)

np.column_stack((a,d)) #Create stacked column wise arrays

np.c_[a,d] #Create stacked column wise arrays


np.hsplit(a,3) #Split the array horizontally at the 3rd index

np.vsplit(c,2) #Split the array vertically at the 2nd index
Python Pandas | Introduction
Pandas : Python module/library enhancing data manipulation tools designed to make data cleaning and analysis fast and convenient in Python. Works intandem with numpy and is the core working under the hood.
- Intro
- Pandas Summary
- Pandas Import/Export [Read/Write]
- Pandas Data Cleaning
- Date & Time
- Joins & Merge
- Let us get our hands dirty
- Bonus material
0    4
1    7
2   -5
3    3
dtype: int64
Main difference of pandas with numpy is that it has indexed values and designed for working with tabular or heterogeneous data.
Pandas relies on dataframes this is excel like data format with rows/records and columns/fields. Which mankes it easy to work with.
Each row stands for an observation and columns here are variables.
Code
| county | headquarters | population | |
|---|---|---|---|
| 0 | Nairobi | Nairobi | 4397073 |
| 1 | Kiambu | Kiambu | 2417735 |
| 2 | Kajiado | Kajiado | 1117840 |
| 3 | Machakos | Machakos | 1421932 |
Checking and investigating the dataframe
Read CSV
Read excel
| Function | Description |
|---|---|
| read_csv | Load delimited data from a file, URL, or file-like object; use comma as default delimiter |
| read_fwf | Read data in fixed-width column format (i.e., no delimiters) |
| read_clipboard | Variation of read_csv that reads data from the clipboard; useful for converting tables from web pages |
| read_excel | Read tabular data from an Excel XLS or XLSX file |
| read_hdf | Read HDF5 files written by pandas |
| read_html | Read all tables found in the given HTML document |
| read_json | Read data from a JSON (JavaScript Object Notation) string representation, file, URL, or file-like object |
| read_feather | Read the Feather binary file format |
| read_orc | Read the Apache ORC binary file format |
| read_parquet | Read the Apache Parquet binary file format |
| read_pickle | Read an object stored by pandas using the Python pickle format |
| read_sas | Read a SAS dataset stored in one of the SAS system’s custom storage formats |
| read_spss | Read a data file created by SPSS |
| read_sql | Read the results of a SQL query (using SQLAlchemy) |
| read_sql_table | Read a whole SQL table (using SQLAlchemy); equivalent to using a query that selects everything in that table using read_sql |
| read_stata | Read a dataset from Stata file format |
| read_xml | Read a table of data from an XML file |
80% of the work done on data is cleaning
Dealing with missing data
| Method | Description |
|---|---|
| dropna | Filter axis labels based on whether values for each label have missing data, with varying thresholds for how much missing data to tolerate. |
| fillna | Fill in missing data with some value or using an interpolation method such as “ffill” or “bfill”. |
| isna | Return Boolean values indicating which values are missing/NA. |
| notna | Negation of isna, returns True for non-NA values and False for NA values. |
Data Transformation
Removing Duplicates
Sample Cleaning
Code
# Reading data using pandas
df = pd.read_csv("https://rcs.bu.edu/examples/python/DataAnalysis/Salaries.csv")
# List first 5 records
df.head()

#Select column

df['sex']
df.sex

# #Group data using rank
df_rank = df.groupby(["rank"])

df_rank.head()

# #Calculate mean value for each numeric column per each group
df_rank.mean()

# Once groupby object is created we can calculate various statistics for each group:

#Calculate mean salary for each professor rank:
df.groupby('rank')[['salary']].mean()

# Note: If single brackets are used to specify the column (e.g. salary), then the output is Pandas Series object.
# When double brackets are used the output is a Data Frame


#Calculate mean salary for each professor rank:
df.groupby(['rank'], sort=False)[['salary']].mean()


# subset the rows in which the salary value is greater than $120K:
df_sub = df[df['salary'] > 120000]
df_sub.head()

#Select only those rows that contain female professors:
df_f = df[df['sex'] == 'Female']

#Selecting rows
df[0:10]

#Select rows by their labels:
df_sub.loc[10:20,['rank','sex','salary']]


#Select rows by their labels:
df_sub.iloc[10:20,[0, 3, 4, 5]]


#We can sort the data using 2 or more columns:
df_sorted = df.sort_values( by =['service', 'salary'], ascending = [True, False])
df_sorted.head(10)
Sample 2*
Code
# Read a dataset with missing values
flights = pd.read_csv("https://rcs.bu.edu/examples/python/DataAnalysis/flights.csv")

# Select the rows that have at least one missing value
flights[flights.isnull().any(axis=1)].head()


#There are a number of methods to deal with missing values in the data frame:

#df.dropna(): drop missing observations
#df.dropna(how = "all"):  drop observtions where all cells is NA
#df.dropna(axis = 1,how = "all"): drop column if all the values are missing
#df.dropna(thresh = 5): Drop rows that contain less than 5 non-missing values
#df.fillna(0): Replace missing values with zeros
#df.isnull(): returns True if the value is missing
#df.notnull(): Returns True for non-missing values
Aggregation Functions in Pandas
Aggregation - computing a summary statistic about each group, i.e. compute group sums or means compute group sizes/counts
Common aggregation functions:
min, max count, sum, prod mean, median, mode, mad std, var
- Date: Handles dates without time.
- POSIXct: Handles date & time in calendar time.
- POSIXlt: Handles date & time in local time.
- Hms: Parses periods with hour, minute, and second
- Timestamp: Represents a single pandas date & time
- Interval: Defines an open or closed range between dates and times
- Time delta: Computes time difference between different datetimes
ISO8601 datetime format (YYYY-MM-DD HH:MM:SS TZ)
datetime.datetime(2024, 11, 20, 23, 18, 31, 754285)Parsing dates, datetimes, and times
Code
iso = pd.to_datetime(['2018-10-26 12:00', '2018-10-26 13:00'], utc=True)

us = ['07/20/1969 20:17:40','11/19/1969 06:54:35']

non_us = ['20/07/1969 20:17:40','19/11/1969 06:54:35']

parts = pd.DataFrame({
  'year' : [1969,1969,1971],
  'month' : [7,11,2],
  'day' : [20,19,5]
})

# Parse dates in ISO format
pd.to_datetime(iso)

# Parse dates in US format
pd.to_datetime(us, dayfirst=False)

# Parse dates in NON US format
pd.to_datetime(non_us, dayfirst=True)

# Parse dates, guessing a single format
pd.to_datetime(iso, infer_datetime_format=True)

# Parse dates in single, specified format
pd.to_datetime(iso, format="%Y-%m-%d %H:%M:%S")

# Parse dates in single, specified format
pd.to_datetime(us, format="%m/%d/%Y %H:%M:%S")

# Make dates from components
pd.to_datetime(parts)
0 1969-07-20
1 1969-11-19
2 1971-02-05
dtype: datetime64[ns]Extracting components
Code
# Parse strings to datetimes
dttm = pd.to_datetime(iso)

# Get year from datetime pandas series
dttm.year

# Get day of the year from datetime pandas series
dttm.day_of_year

# Get month name from datetime pandas series
dttm.month_name()

# Get day name from datetime pandas series
dttm.day_name()

# Get datetime.datetime format from datetime pandas series
dttm.to_pydatetime()
array([datetime.datetime(2018, 10, 26, 12, 0, tzinfo=datetime.timezone.utc),
datetime.datetime(2018, 10, 26, 13, 0, tzinfo=datetime.timezone.utc)],
dtype=object)Rounding Dates
Code
DatetimeIndex(['2018-10-26 12:00:00+00:00', '2018-10-26 13:00:00+00:00'], dtype='datetime64[ns, UTC]', freq=None)Arithmetic
Code
datetime.datetime(2022, 8, 6, 11, 13, 50)Time Intervals
Code
# Create interval datetimes
start_1 = pd.Timestamp('2021-10-21 03:02:10')
finish_1 = pd.Timestamp('2022-09-15 10:03:30')
start_2 = pd.Timestamp('2022-08-21 03:02:10')
finish_2 = pd.Timestamp('2022-12-15 10:03:30')

# Specify the interval between two datetimes
pd.Interval(start_1, finish_1, closed='right')

# Get the length of an interval
pd.Interval(start_1, finish_1, closed='right').length

# Determine if two intervals are intersecting
pd.Interval(start_1, finish_1, closed='right').overlaps(pd.Interval(start_2, finish_2, closed='right'))TrueTime Deltas
Merge*
Code
df1 = pd.DataFrame({'employee': ['Bob', 'Jake', 'Lisa', 'Sue'],
                    'group': ['Accounting', 'Engineering', 'Engineering', 'HR']})
df2 = pd.DataFrame({'employee': ['Lisa', 'Bob', 'Jake', 'Sue'],
                    'hire_date': [2004, 2008, 2012, 2014]})

df3 = pd.merge(df1, df2)
df3


df4 = pd.DataFrame({'group': ['Accounting', 'Engineering', 'HR'],
                    'supervisor': ['Carly', 'Guido', 'Steve']})

pd.merge(df3, df4)

#Many-to-many joins

df5 = pd.DataFrame({'group': ['Accounting', 'Accounting',
                              'Engineering', 'Engineering', 'HR', 'HR'],
                    'skills': ['math', 'spreadsheets', 'coding', 'linux',
                               'spreadsheets', 'organization']})

pd.merge(df1, df5)


df3 = pd.DataFrame({'name': ['Bob', 'Jake', 'Lisa', 'Sue'],
                    'salary': [70000, 80000, 120000, 90000]})

pd.merge(df1, df3, left_on="employee", right_on="name")

#Drop redundant column
pd.merge(df1, df3, left_on="employee", right_on="name").drop('name', axis=1)
Join
Code
df1a = df1.set_index('employee')
df2a = df2.set_index('employee')

pd.merge(df1a, df2a, left_index=True, right_index=True)


#For convenience, DataFrames implement the join() method, which performs a merge that defaults to joining on indices:

df1a.join(df2a)


df6 = pd.DataFrame({'name': ['Peter', 'Paul', 'Mary'],
                    'food': ['fish', 'beans', 'bread']},
                   columns=['name', 'food'])
df7 = pd.DataFrame({'name': ['Mary', 'Joseph'],
                    'drink': ['wine', 'beer']},
                   columns=['name', 'drink'])


pd.merge(df6, df7)

#Inner Join

pd.merge(df6, df7, how='inner')

#Other options for the how keyword are 'outer', 'left', and 'right'. An outer join returns a join over the union of the input columns, and fills in all missing values with NAs

pd.merge(df6, df7, how='outer')


pd.merge(df6, df7, how='left')
From the google drive link request for access and download the data google drive
- Download the state data
- Merge the three different csv’s
- Rank the population density for the different states in 2010
- population density calculation = population size / state size area
- Top 3 states
Collapsing data into categories Map categories to fewer ones: reducing categories in categorical column.
Code
# Create mapping dictionary and replace
mapping = {'Microsoft':'ComputerOS', 'MacOS':'ComputerOS', 'Linux':'ComputerOS',
'IOS':'MobileOS', 'Android':'MobileOS'}
devices['operating_system'] = devices['operating_system'].replace(mapping)
devices['operating_system'].unique()


# Replace "+" with "00"
phones["Phone number"] = phones["Phone number"].str.replace("+", "00")
phones

# Replace "-" with nothing
phones["Phone number"] = phones["Phone number"].str.replace("-", "")
phones


# Replace phone numbers with lower than 10 digits to NaN
digits = phones['Phone number'].str.len()
phones.loc[digits < 10, "Phone number"] = np.nan
phones


# Replace letters with nothing
phones['Phone number'] = phones['Phone number'].str.replace(r'\D+', '')
phones.head()


# Treating date data
birthdays['Birthday'] = birthdays['Birthday'].dt.strftime("%d-%m-%Y")
birthdays.head()


sum_classes = flights[['economy_class', 'business_class', 'first_class']].sum(axis = 1)
passenger_equ = sum_classes == flights['total_passengers']
# Find and filter out rows with inconsistent passengers
inconsistent_pass = flights[~passenger_equ]
consistent_pass = flights[passenger_equ]


# Drop missing values
airquality_dropped = airquality.dropna(subset = ['CO2'])
airquality_dropped.head()

#Replacing with statistical measures
co2_mean = airquality['CO2'].mean()
airquality_imputed = airquality.fillna({'CO2': co2_mean})
airquality_imputed.head()


# Multiple grouped summaries
dogs.groupby("color")["weight_kg"].agg([min, max, sum])

# Grouping by multiple variables
dogs.groupby(["color", "breed"])["weight_kg"].mean()

dogs.groupby(["color", "breed"])[["weight_kg", "height_cm"]].mean()


# Group by to pivot table
dogs.pivot_table(values="weight_kg", index="color")


# Different statistics
import numpy as np
dogs.pivot_table(values="weight_kg", index="color", aggfunc=np.median)

# Multiple statistics
dogs.pivot_table(values="weight_kg", index="color", aggfunc=[np.mean, np.median])

dogs.pivot_table(values="weight_kg", index="color", columns="breed")

# Filling missing values in pivot tables
dogs.pivot_table(values="weight_kg", index="color", columns="breed",
fill_value=0)

# Summing with pivot tables
dogs.pivot_table(values="weight_kg", index="color", columns="breed",
fill_value=0, margins=True)
Visualization
The point of visualization is being able to summary data to palatable chunks, easy to read and digest. Quick glances and be able to tell a story.
Humans are visual, absorbing more through image than any other thing. There are very many examples of visuals that have impacted the world I will talk about 3.
- The general minrad maps
- The nurse crimea wars
- The Doctor cholera maps
Any visual should be able to tell a story either for record purposes and future solutions, predictions.
Python Visualization | Matplotlip & Seaborn
Python provides so many modules for visualization but for purposes of the training we will deal with the two most common visualiation tools.
- matplotlib
- seaborn
- plotnine
- altair
- Bokeh
Matplotlib is the “grandfather” library of data visualization with Python. It was created by John Hunter. He created it to try to replicate MatLab’s (another programming language) plotting capabilities in Python. So if you happen to be familiar with matlab, matplotlib will feel natural to you.
It is an excellent 2D and 3D graphics library for generating scientific figures.
Some of the major Pros of Matplotlib are:
- Generally easy to get started for simple plots
- Support for custom labels and texts
- Great control of every element in a figure
- High-quality output in many formats
- Very customizable in general
Matplotlib allows you to create reproducible figures programmatically. Let’s learn how to use it! Before continuing this lecture, I encourage you just to explore the official Matplotlib web page: http://matplotlib.org/
Since we are using ipython notebook we need to run %matplotlib inline before running the plot
Code

Bar charts
Code

Pie charts
Code

Box plots

Seaborn module for visualization
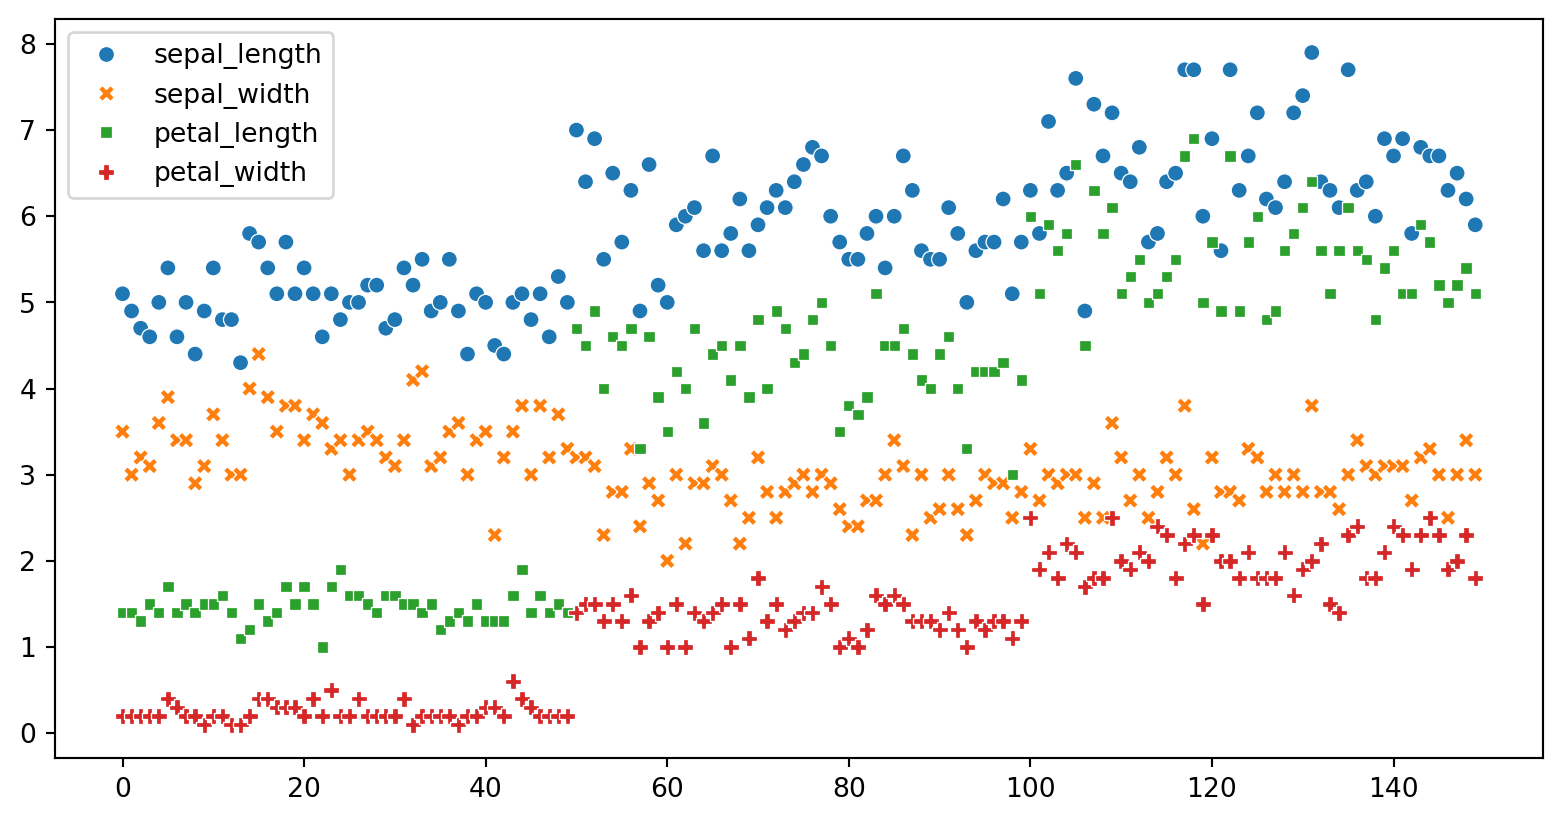
Line Graph
Code
<Axes: xlabel='sepal_length', ylabel='sepal_width'>
Scatter Graph
Code
<Axes: xlabel='total_bill', ylabel='tip'>
Code
import seaborn as sns

import matplotlib.pyplot as plt


tips = sns.load_dataset("tips")


# customize the scatter plot

sns.scatterplot(x="total_bill", y="tip", hue="sex", size="size", sizes=(50, 200), data=tips)


# add labels and title

plt.xlabel("Total Bill")

plt.ylabel("Tip")

plt.title("Relationship between Total Bill and Tip")


# display the plot

plt.show()
- df.plot.area
- df.plot.barh
- df.plot.density
- df.plot.hist
- df.plot.line
- df.plot.scatter
- df.plot.bar
- df.plot.box
- df.plot.hexbin
- df.plot.kde
- df.plot.pie